Business Intelligence & Data AnalyticsTransforming Data into Decisions That Drive Impact
What We Do Data Analytics with ML Models
We offer end-to-end data services from strategy to execution, tailored to your business goals and operational realities
Business Intelligence Solutions
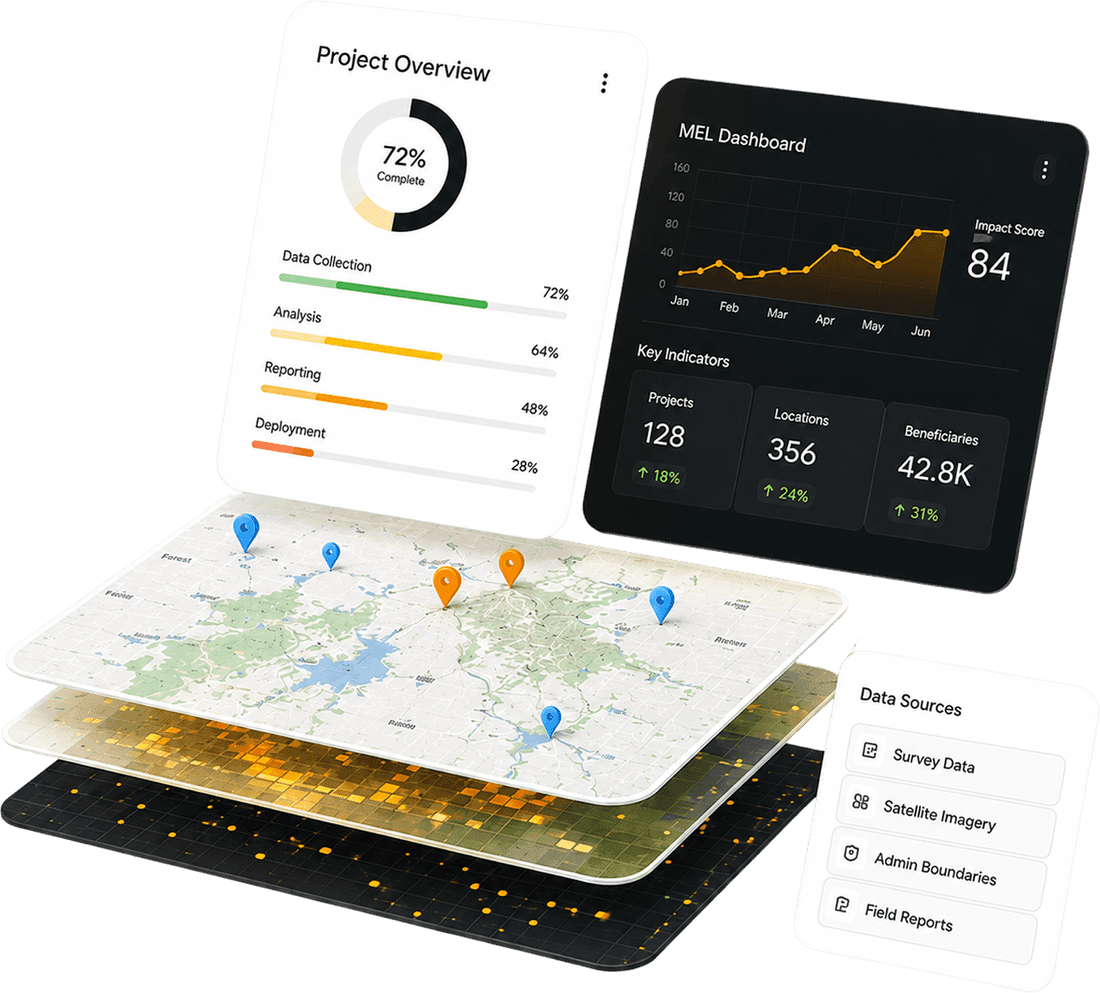
Design and development of interactive dashboards for real-time monitoring and decision-making
KPI tracking across departments, programs, and geographies
Role-based access to insights, ensuring the right data reaches the right people

Business Intelligence Solutions
Design and development of interactive dashboards for real-time monitoring and decision-making
KPI tracking across departments, programs, and geographies
Role-based access to insights, ensuring the right data reaches the right people

Advanced Data Analytics
Descriptive, diagnostic, predictive, and prescriptive analytics using statistical and machine learning models
Time-series forecasting, trend analysis, and anomaly detection
Customer segmentation, churn prediction, and behavioral modeling
Advanced Data Analytics
Descriptive, diagnostic, predictive, and prescriptive analytics using statistical and machine learning models
Time-series forecasting, trend analysis, and anomaly detection
Customer segmentation, churn prediction, and behavioral modeling
Data Engineering & Warehousing
ETL pipeline development for structured and unstructured data sources
Data lake and data warehouse architecture using platforms like Azure, AWS, and Google Cloud.
Real-time and batch data processing for scalable analytics.

Data Engineering & Warehousing
ETL pipeline development for structured and unstructured data sources
Data lake and data warehouse architecture using platforms like Azure, AWS, and Google Cloud.
Real-time and batch data processing for scalable analytics.

Integration & Automation
Seamless integration with ERP, CRM, MIS, and GIS systems.
API-based data exchange and automation of reporting workflows.
Automated alerts and notifications based on data thresholds or events.
Integration & Automation
Seamless integration with ERP, CRM, MIS, and GIS systems.
API-based data exchange and automation of reporting workflows.
Automated alerts and notifications based on data thresholds or events.
Mobile & Web-Based Analytics
Responsive dashboards accessible via mobile and web platforms.
Offline data capture and sync for field-level analytics.
Embedded analytics within operational apps for contextual insights.

Mobile & Web-Based Analytics
Responsive dashboards accessible via mobile and web platforms.
Offline data capture and sync for field-level analytics.
Embedded analytics within operational apps for contextual insights.

Data Governance & Security
Implementation of data access policies and audit trails.
Data anonymization and encryption for sensitive datasets.
Compliance with GDPR, HIPAA, and other regulatory frameworks.
Data Governance & Security
Implementation of data access policies and audit trails.
Data anonymization and encryption for sensitive datasets.
Compliance with GDPR, HIPAA, and other regulatory frameworks.

Our Impact & Achievements
We’ve helped clients across sectors harness the power of data to solve real-world challenges. Some of our proudest accomplishments include

National-level performance dashboards for government ministries tracking health, education, and infrastructure KPIs.
Real-time analytics for NGO programs, enabling adaptive management and evidence-based reporting.
Predictive models for financial institutions to assess credit risk and optimize loan portfolios.
Impact measurement frameworks for donor-funded projects, linking outcomes to investments.


Our Approach to Solution
We don’t just crunch numbers, we build data ecosystems that evolve with your organization
Discovery & Strategy
We begin by understanding your business goals, data maturity, and pain points.
Our team collaborates with stakeholders to define KPIs, data sources, and success metrics.
Agile Development
We follow an iterative development model, delivering analytics modules in phases.
Early prototypes and feedback loops ensure alignment and reduce rework.
Capacity Building
We train your teams to interpret dashboards, run queries, and make data-driven decisions.
Documentation and user manuals are provided for long-term sustainability.

Why Streams Tech?
Proprietary and open‑source stack to match your infrastructure, budget and operational need

Domain Expertise
From agriculture to finance, we understand the nuances of your data.

Technology Agnostic
We work with Power BI, Tableau, Looker, Metabase, Superset, and custom-built platforms.

Scalable Architecture
Whether you're a startup or a national agency, our systems grow with you.

Human-Centered Design
We build interfaces that are intuitive, accessible, and actionable.
Domain Expertise
From agriculture to finance, we understand the nuances of your data.
Technology Agnostic
We work with Power BI, Tableau, Looker, Metabase, Superset, and custom-built platforms.
Scalable Architecture
Whether you're a startup or a national agency, our systems grow with you.
Human-Centered Design
We build interfaces that are intuitive, accessible, and actionable.
Turning Complex Data into Clear Insights, Explore Our Analytics Portfolio

Web-based Tools for Ezispeak
Client:
Ezispeak
Streams Tech developed a web-based BI application for Ezispeak, using Power BI to provide clients with secure, personalized dashboards displaying KPIs, service metrics, reports, and invoices in real time.
Key Features
- Client-Specific Portals – Secure access to personalized reports and invoices.
- Power BI Integration – Interactive charts and tables embedded in the website.
- KPI Reporting – Tracks call volume, duration, response time, and language services.
A Data Visualization Dashboard for a Law Firm
Client:

US-based Law Firm
Streams Tech built a secure web dashboard for a multi-state U.S. law firm to track attorney hours, billing, profitability, and client acquisition. The system provides clear revenue insights and supports PDF export and automated email reporting.
Key Features
- Reports the number of hours worked, amount charged, and profit earned by each attorney
- Shows the number of new customers acquired in a specific period
- Generates reports on office-wide revenue and cost


DynamicWeb Team Reports Dashboard
Client:

DynamicWeb
Streams Tech developed a BI dashboard for DynamicWeb, enabling clients to monitor project teams with real-time KPIs, visual charts, and utilization data, improving transparency, performance tracking, and resource management.
Key Features
- Dynamic KPI Tracking – Real-time target vs actual performance.
- Tabular & Graphical Views – Employee assignments per project.
- Project Utilization Insights – Monitor resource usage effectively.

Client Experiences That Speak for Themselves
I'm very happy to provide this heartfelt testimonial for Streams Tech and their exceptional work in Power BI, SQL Server, and data analytics for our company, Dynamic Web. Their team has expertly created multiple Power BI dashboards, set up SQL Server Reporting Services reports, and provided advanced technical solutions, always delivering the right fit for our needs. We're thankful for their continued partnership.
I'm very happy to provide this heartfelt testimonial for Streams Tech and their exceptional work in Power BI, SQL Server, and data analytics for our company, Dynamic Web. Their team has expertly created multiple Power BI dashboards, set up SQL Server Reporting Services reports, and provided advanced technical solutions, always delivering the right fit for our needs. We're thankful for their continued partnership.
Scott Forsyth
CTO at Dynamic Web North America


Streams Tech has been a game changer for Askd, a market research company in South Africa. Since 2019, their team has provided excellent services, helping us enrich our clients' data and analytics. I highly recommend Streams Tech for their transformative solutions that will elevate your business.
Streams Tech has been a game changer for Askd, a market research company in South Africa. Since 2019, their team has provided excellent services, helping us enrich our clients' data and analytics. I highly recommend Streams Tech for their transformative solutions that will elevate your business.
Steven Johnstone
Owner and COO of Ask'd


We’ve been working with Streams Tech for several years on data analytics and web development projects in Malaysia and Brunei. The team has been great to partner with. Their excellent communication and timely responses have ensured successful project completion. We're excited to continue this partnership on future projects.
We’ve been working with Streams Tech for several years on data analytics and web development projects in Malaysia and Brunei. The team has been great to partner with. Their excellent communication and timely responses have ensured successful project completion. We're excited to continue this partnership on future projects.
Dharmik Seth
Director of ST Advisory


The contribution Streams Tech provide has been remarkable in the implementation of SQL solutions, SQL Server, administration, and Power BI. Their contribution has not only improved our data management, but also made us more competitive. Thank you, Streams Tech.
The contribution Streams Tech provide has been remarkable in the implementation of SQL solutions, SQL Server, administration, and Power BI. Their contribution has not only improved our data management, but also made us more competitive. Thank you, Streams Tech.
Giovanni Basso
International Business Manager at Philmark


We engaged Streams Tech to build us a data pipeline and PowerBI dashboard and were very impressed with their depth of knowledge and thoughtful, considered approach at all times. As a result, will continue to engage them for our future needs.
We engaged Streams Tech to build us a data pipeline and PowerBI dashboard and were very impressed with their depth of knowledge and thoughtful, considered approach at all times. As a result, will continue to engage them for our future needs.
Garron Lipschitz
CEO at Confidence Club


Let’s Build Your Data Advantage
From starting analytics to scaling insights, Streams Tech helps turn your data into decisions that matter